

How new water tools reveal changes in water use with nation-wide implications. By Rob Lawson.
While the UK water industry has rightly strived to provide safe and secure water supplies, it has not always been able to meet customers’ unrestricted demand. Every so often, severe dry spells (as exemplified in summer 2018) mean water companies resort to restrictions, such as hosepipe bans.
That approach no longer suffices. Climate change and population growth are intensifying the pressure on water resources, making demand management a daily priority. And while extensive metering, efficiency campaigns, and the reduced size of toilet cisterns have all helped, these old, crude and blunt responses must graduate to proactive technologies.
Indeed, to meet looming household water use targets, the pace of change – and motivation to do so — must accelerate. To speed this transition, digital water offers a powerful catalyst.
Conventional wisdom holds that people can reduce the water use at home by either changing social norms (turning off taps while brushing teeth) or tools (dual flush toilets). The truth is that behaviour and technology have always been intrinsically linked.
Consider how a century ago most people took a weekly bath. Now we take daily or even twice-daily showers. Change emerged through the combination of ‘infrastructure’ (better hot water boilers, standardised plumbing, and en-suite bathrooms) and social practice around personal hygiene and cleanliness.
Household water use has not only been irrevocably disrupted. It continues to be.
This realisation led UK Water Industry Research in 2006 to ask Artesia to harness data in ways that could group customers into five ‘typologies,’ based on their perceived likelihood to be water efficient.
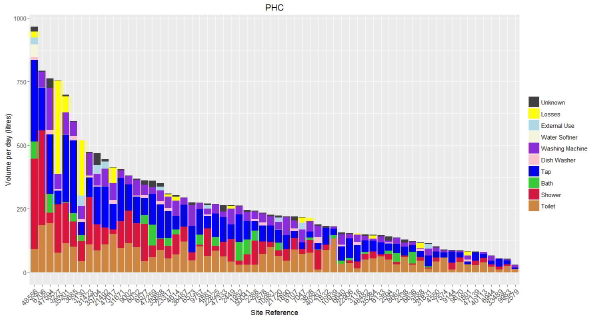
To test and validate earlier efforts, our more rigorous project collected, then re-surveyed, a detailed record of consumption at 62 properties. By doing so, researchers could identify not only how water was being used – to flush, shower, wash clothes etc. – but also, importantly when during the day they used it.
The data revealed fascinating insights. Across the sample of properties, water use varied extensively, both in terms of the total volume used and the end uses themselves. [See Figure A] Beyond the remarkable range of consumption, note how some properties use the same amount of water for very different reasons.
What’s more, customer typologies, based on survey responses, did not reflect how much water people actually used. Granted, sample size and self-selection bias may have influenced the results. But it also reflects how people may give answers they feel are socially acceptable when taking part in a survey.
Half of the observed differences in household water use could be attributed to the number, or ‘occupancy,’ of residents. Yet curiously, a third of the differences in consumption were driven by an unidentified aspect of customer behaviour, which we then set out to investigate.
With the benefit of near-realtime metering, the research team began to look at sub-daily patterns of consumption to see if factors such as home-offices affected results. In fact, daytime occupancy was not relevant to the results. Something unexpected was at work.
Studying the data, we learned to organize households based on the time, on weekday mornings, people most often flushed their toilets. Call it: ‘waking-up time.’ [See Figure B]

These three waking-up groupings – 6am-8am, 8am- 10am and 10am-noon — were further analysed using end use data and survey results. This demonstrated significant common factors within the groups and notable differences between the groups.
For starters, the earliest risers have the most diurnal pattern of water use, with a clear spike in the morning and later in the evening, compared to the other two groups.
These early bird households also have the largest collective consumption, while individuals in the latest rising households each uses more than in the other groups.
Curiously, rates of washing machine use and plumbing losses are greatest for the earliest risers.
Finally, households who wake up between 0800 and 1000 use less water for showering than the two other groups.
All three groups did share some common characteristics [as indicated in Table C].
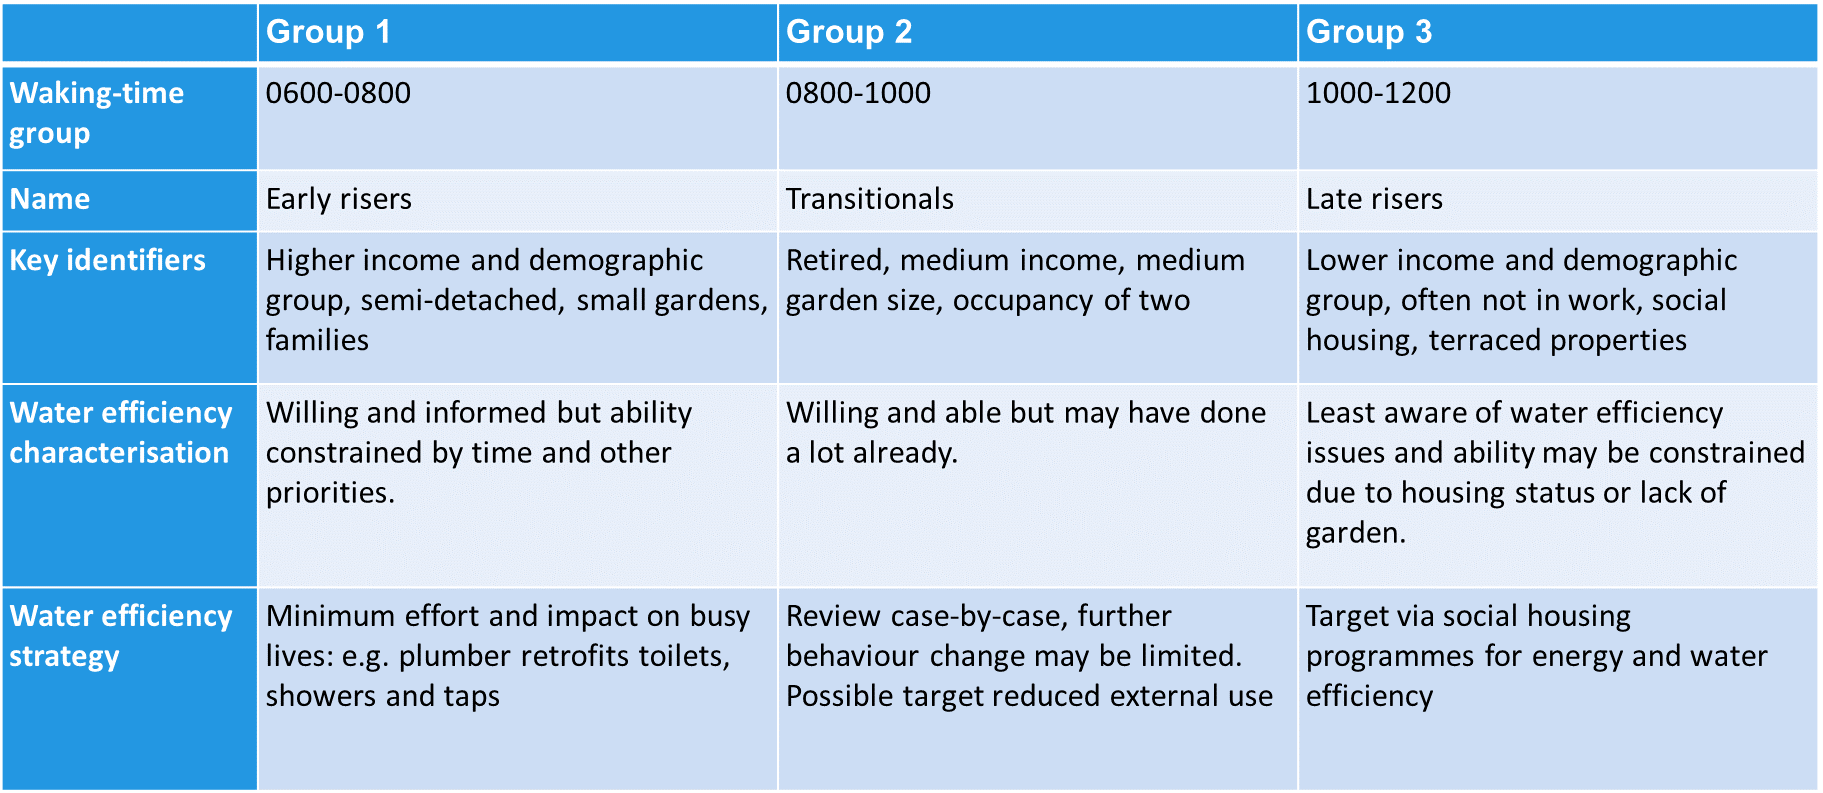
Perhaps most salient, the research in this table shows how water efficiency strategies can best be custom-designed to the needs and patterns specific to each group’s water-use behaviour. Since early risers are “willing and informed” yet “time poor,” for example, interventions and technologies could aim to have minimal impact on their busy lives.
This research emphasizes the importance of good data for developing targeted and effective campaigns. By parsing the data, more promising approaches can reduce water use to the levels envisaged by levels now being envisaged by UK water regulators and advisory bodies such as the National Infrastructure Commission.
Yet all too often, water companies do not currently know enough about their individual accounts to deliver such carefully targeted activities and calibrated efforts. That must change.
To be sure, they need not know exactly what time each metered water user first flushes the toilet each morning. Yet to deliver ambitious water efficiency targets, companies will have to better understand patterns of human behaviour. That means spending time and money researching the links between the above kinds of variables, combined with better knowledge of occupancy and household types.
Each small household insight may seem slight, minor, quaint, even droll. But in aggregate, they offer a powerful tipping point, rewarding our investments in simple monitoring and surveys by catalysing big, complex, and national-scale changes.


