
About one-third of the world’s population relies on groundwater for drinking. Roughly 10 percent of wells contain elevated concentrations of the geogenic contaminants arsenic and fluoride, affecting hundreds of millions of people. In many parts of the world, but particularly in developing countries, the presence and/or distribution of geogenic and other non-point-source anthropogenic contaminants (e.g. nitrate) is poorly understood. That is, in some areas, the majority of wells have not yet been tested, and it is unclear which areas to prioritize and commit limited water quality testing resources to.
To help monitor and assess this limited resource, the Groundwater Assessment Platform was developed as a free online GIS platform for the analysis and modelling of groundwater quality data. Building upon experience in creating prediction maps of arsenic and fluoride, GAP was developed to allow users to view existing global, regional and country-scale prediction maps along with various datasets often used as predictor or proxy variables of these contaminants. These include, for example, datasets relating to geology, soil, climate and topography. In addition, GAP includes data points of known contaminant concentrations, assembled from various sources.
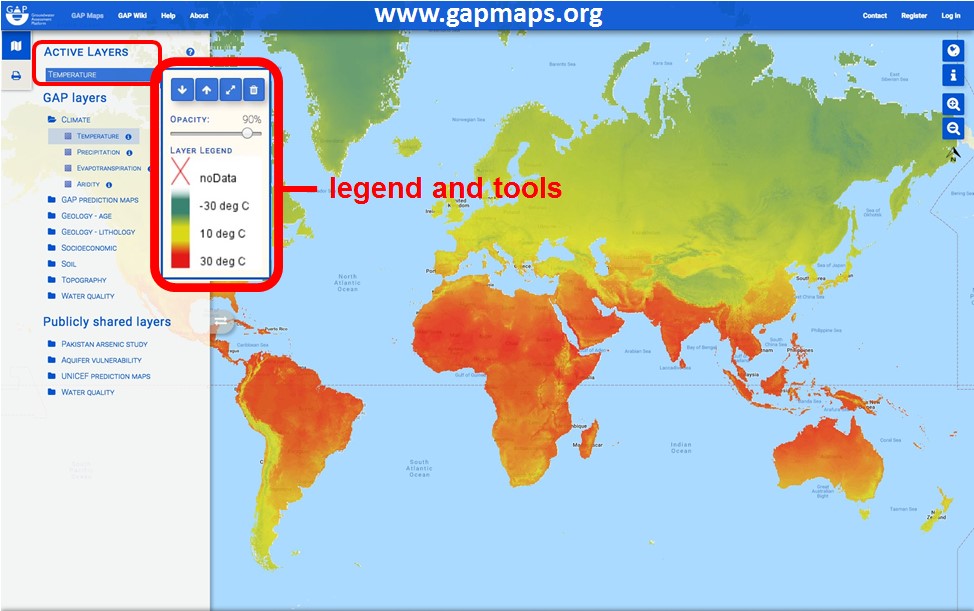
The GAP online platform is a GIS system (Fig. 1) that includes the functionality to turn layers on and off, modify the ordering of layers and their transparency and to click on the map to obtain the values of all displayed layers. Once logged on, users can upload their own point, polygon or raster data, modify the symbology and share their data with other users, groups of users or the public. The sharing of data privately with users or user groups facilitates cooperation among individuals and organisations that otherwise require their data be kept confidential. On the other hand, sharing data publicly on GAP provides a way to increase the exposure of one’s work.
GAP offers two types of geospatial modeling for creating hazard prediction maps of contaminants: gridding (inverse distance or nearest neighbor) and logistic regression modeling. Gridding can produce accurate results given a sufficiently high density and even distribution of data points. However, logistic regression modeling produces a model based on statistically significant correlations with spatially continuous predictor, or independent, variables. These variables are generally selected based on their connection, either direct or as a proxy, to the processes of release and accumulation in the environment. The resulting correlations established by logistic regression make it possible to produce a reliable hazard prediction map with relatively few data points or an uneven distribution thereof. That is, so long as the predictor variables exhibit considerable variation at the locations of the available data points, it is possible to produce a model that is accurate throughout the entire study area, even where no data points exist.
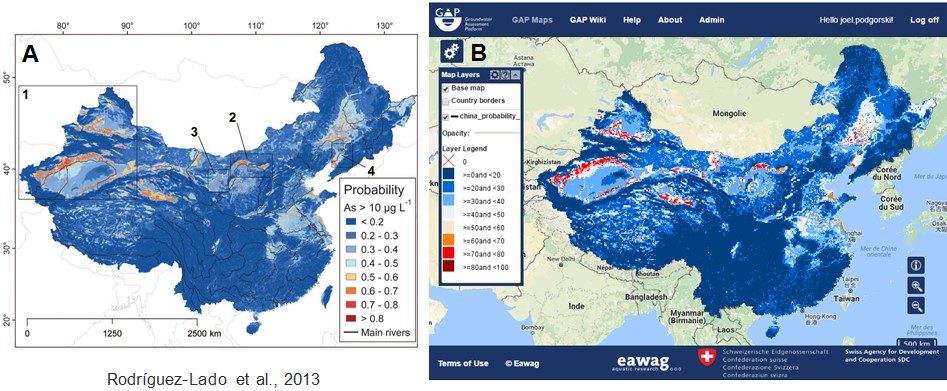
Figure 2A shows a previously published arsenic hazard map of China (Rodríguez-Lado et al., 2013), which used the predictor variables of geology, soil texture, saline soils, topographic wetness index, river density, distance to rivers, gravity and slope. Figure 2B shows the hazard map produced in GAP using the same data points and predictor variables. The resulting map is nearly identical to the previously published map, which was created by manual programming. Any differences can therefore be attributed to the published study’s more complex modeling procedures that are possible when programming the modeling manually outside of GAP. Despite the manual statistical programming approach offering more options for manipulating and modifying data and models, the prediction map produced in GAP is remarkably similar and requires substantially less time to generate, due to GAP’s simple, quick-to-use modeling interface.
Reference:
Rodríguez-Lado, L., Sun, G., Berg, M., Zhang, Q., Xue, H., Zheng, Q., & Johnson, C. A. (2013). Groundwater arsenic contamination throughout China. Science, 341(6148), 866-868.


